We explain what a graphic scale is and what it is for. Also, some examples and their differences with the numerical scale.

What is a graphic scale?
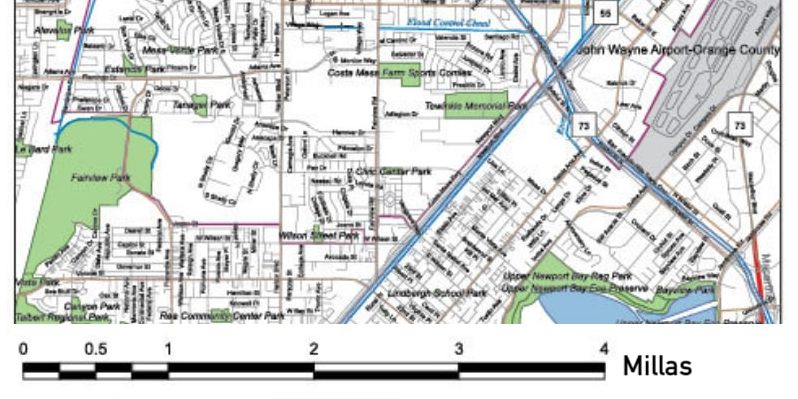
A graphic scale is a symbol that appears on maps, plans, nautical charts and other similar documents, and that expresses the relationship between the proportions of a segment of reality and those of the drawing through which it is represented. That is, it is a graphic element that allows us to understand the representation scale used.
This symbol consists of a straight graduated line, divided into equal partswhose units express the relationship between the real dimensions and their equivalent in drawing units. Thus, each drawn unit is equivalent to a set of real units of measurement.
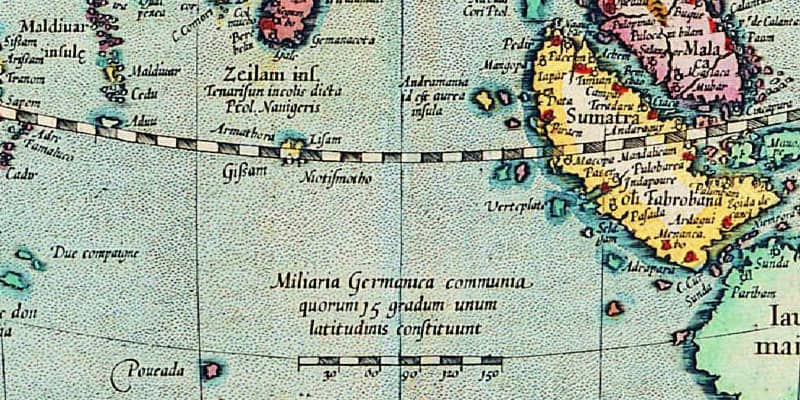
The graphic scale It was used for the first time in Pisan menu from the end of the 13th centurya map of the Mediterranean and Black Seas, and part of the Atlantic Ocean found in the Pisa region, Italy. Its graphic scale consists of a circle of radius divided into three equal parts, each of which non-numerically represents a scaled distance on the map.
As time went by, this design changed towards the shape of a straight line, both vertical and horizontal, generally located on the edges of the maps. Maritimely, it is known as “trunk of leagues”.
See also: Scale
Key points
- A graphic scale is a symbol or design that visually expresses the proportion between the dimensions represented in a geographical or cartographic document, and the real ones.
- It helps the reader get an idea of what the distances, heights and depths represented on a plane really are.
- The graphic scale should not be confused with the numerical scale, which expresses the same information, but using numbers or fractions.
What is a graphic scale for?
The graphic scale provides those who consult a map with information regarding the scale of its representation. That is, it explains the system of equivalences that links the illustration with the real distances of the segment of the Earth's surface.
On the other hand, the graphic scale does not need numbers or numerical relationships, but rather uses a graphic or visual type conventionwhich allows for easier reading.
See also: Reference system
Examples of graphic scale


Differences between graphic scale and numerical scale
Unlike graphical scale, which represents scale using visual proportions, A numerical scale is one that fulfills the same function, but through a set of numerical proportions.
For example, a numerical scale of 1:20 means that each unit in the representation is equivalent to 20 similar real-life units. Thus, it is common to see scales of 1/50,000 or 5/500, depending on the proportions of the object or space that must be represented on a screen or paper.
Both the numerical scale and the graphic scale are common in maps, plans, works of technical drawing, architectural projections and other similar documents. In fact, on some occasions, they can occur together.
document.addEventListener(“DOMContentLoaded”, (e) => { var sliderContainer, slider; sliderContainer = document.getElementById(‘block_90be971d28514659cf40a8ab08db9ff4’); if (typeof initSlider !== ‘function’) { console.log(‘Swiper haven\’t been loaded’); sliderContainer.className += ‘ fw scroll-snap’; return; }; options = { direction: ‘horizontal’, speed: 1000, slidesPerView: ‘auto’, // slidesPerGroup: 1, centerInsufficientSlides: true, // centeredSlides:true, spaceBetween: 15, breakpoints: { 720: { // centeredSlides: false, // slidesPerGroup: 2, spaceBetween: 25 }, }, pagination: { el: ‘.swiper-pagination’, type: ‘bullets’, clickable: true }, } slider = initSlider(sliderContainer, options); })
References
- Mendieta Ocampo, JA (2005). Basic applied cartography. University of Caldas.
- Parreaguirre Camacho, JC (1997). Cartography manual. Euned.


