We explain what a diagram is, its characteristics and what each type is for. Also, understand the step by step to put together a diagram.
What is a diagram?
a diagram It is a graph in which the information is simplified and schematized. of a topic, a theory, a process or a system. It can be simple or complex, with few or many elements.
It is a summary which serves to know and interpret information in a simple and visual way. There are various types of diagrams that They are used according to the communication need or the object of study such as flowcharts, conceptual diagrams and synoptic diagrams.
Diagrams are used in the field of education, communication, work, journalism and other disciplines. Generally, they are made up of small boxes, balloons and arrows that connect the parts to make a whole.
Diagram Features
The diagrams have the following characteristics:
- Simplicity . They simply present an idea, a topic, a concept, a phenomenon, a strategy or a process.
- Synthesis . They provide the most important information on a topic in very little space, since only the relevant ideas or concepts of a topic are included. These ideas or concepts are designated in summary form using keywords.
- Structure . They order the information hierarchically, that is, from the most relevant or most general to the least important or most particular. In other cases, they may show classifications or other types of links between concepts.
- Resources . They include different visual resources, such as geometric figures, symbols, arrows and lines, which allow information to be organized clearly.
- Versatility . They are used to represent different topics of varying length and various disciplines.
Diagram Types
There are multiple types of diagrams that are used for different purposes and in various disciplines.
1. Flowchart

The flow chart is usually the most recognized and most used in the world of work and computing. It details step by step the network of functions and components in a system or procedure.
It is characterized by having processes enclosed in geometric figures that function as symbols. The rectangle with rounded tips is used as a starting and closing point, the common rectangle to detail an action or a process, the rhombus to graph a decision and the arrows to indicate the direction of flow.
2. Conceptual diagram
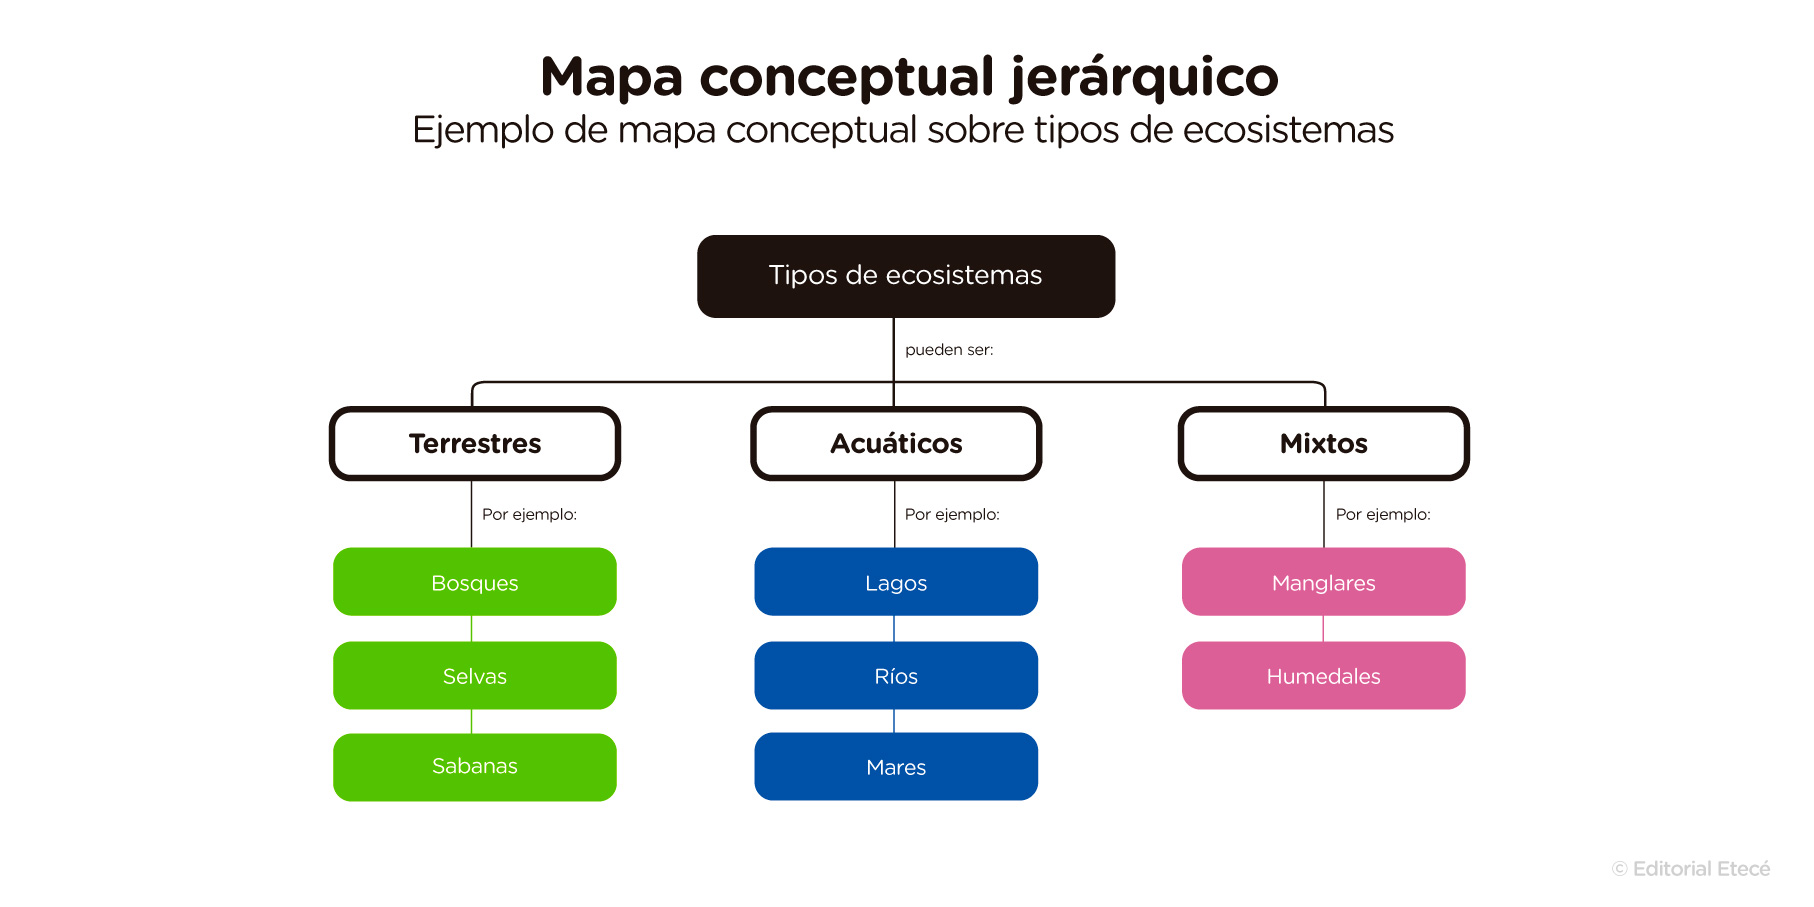
The conceptual diagram, better known as a concept map, is often used to simplify the study. It can be a simple or complex graph, according to the number of concepts and ideas to include and relate.
It presents the information in a hierarchical manner, since it is based on a general concept from which secondary concepts emerge. Concepts are enclosed in balloons or rectangles and connected by lines and linking words.
3. Synoptic diagram

The synoptic diagram, also known as a synoptic table, has greater complexity, since from a central theme or concept a network of concepts and elements that can be related to each other can be widely extended.
It usually has braces and brackets that start from a concept to group ideas and subordinate concepts.
4. Circle diagram
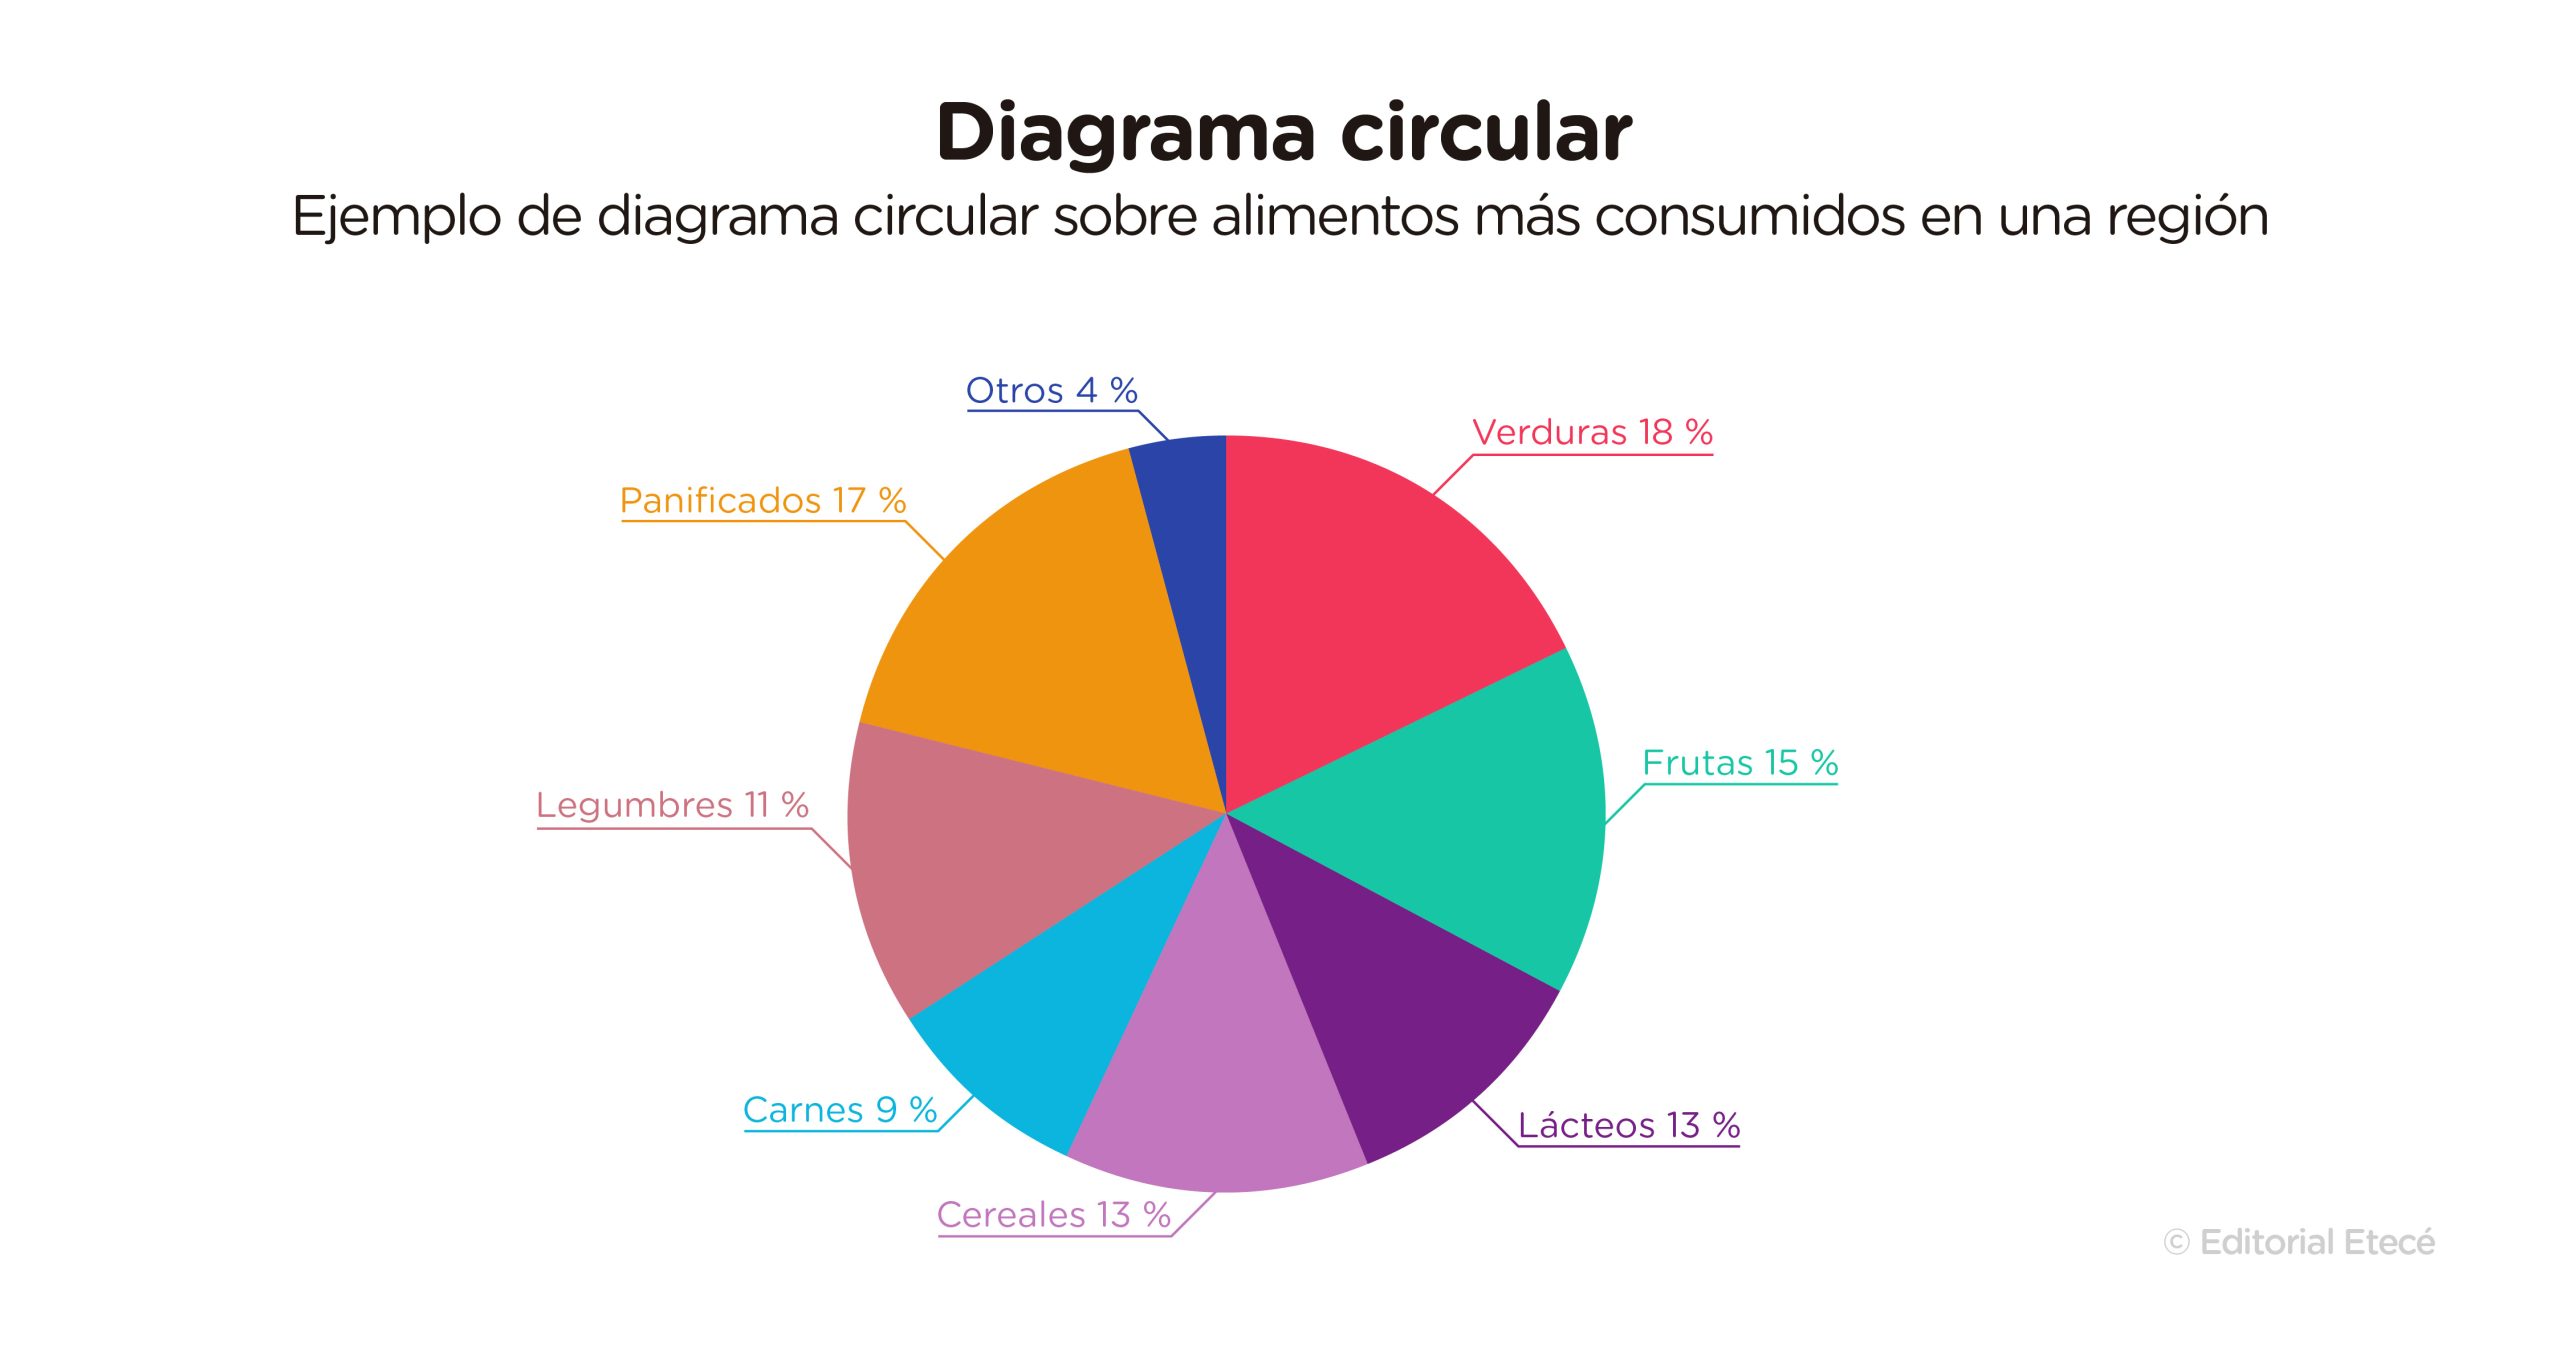
The pie chart is also called a pie chart or chart due to its circular shape. It is used to represent the percentages of something by dividing the circle into sectors that have different sizes according to their proportion.
In addition, the name is usually indicated with words and the percentage of what each sector represents with numbers.
5. Block diagram

The block diagram is used to graph the operation of a system through the use of graphical blocks and their links. It is usually used to outline productive, industrial or electronic processes.
It differs from the flow chart because it does not always indicate a sequential order of steps, but rather it marks how the elements of a process are connected. Also, because it usually includes more details about each block, process or part and because it has specific symbols.
6. Tree diagram

The tree diagram is used to graph the hierarchical order of concepts or ideas, probabilities or decision making.
This type of diagram starts from a central concept towards secondary concepts, possibilities or options that are found after each branch.
7. Scatter plot
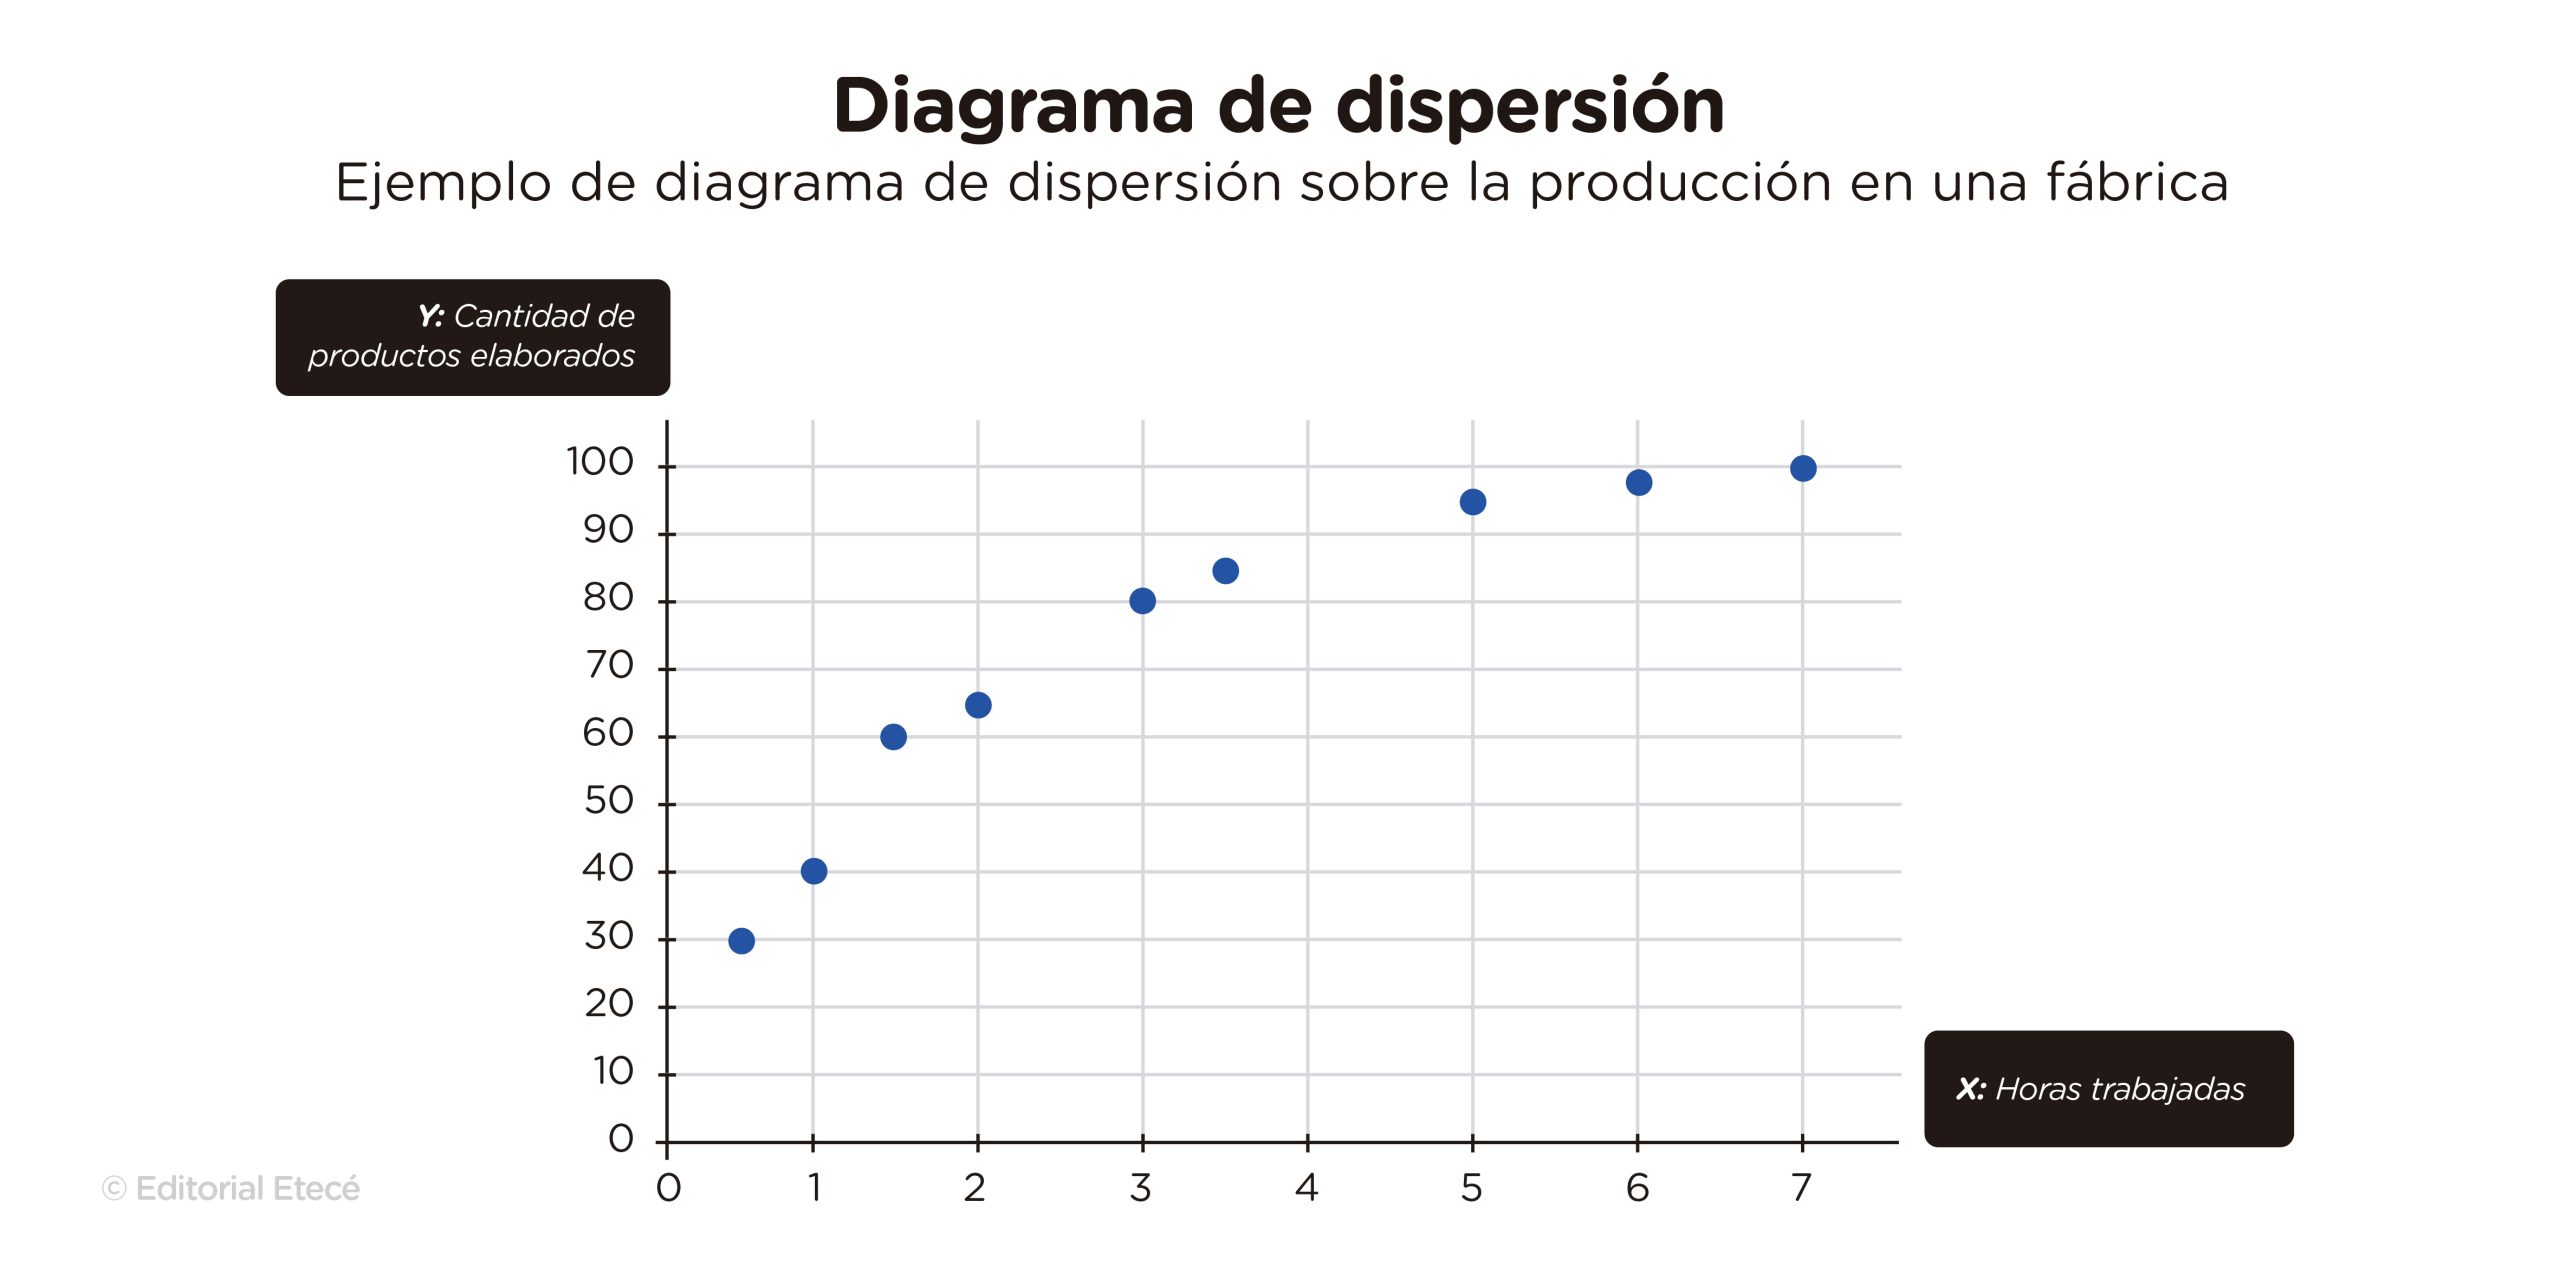
The scatter diagram is used in mathematics and other disciplines, such as statistics, economics and finance, to graph the relationship between data from two variables with two axes (x and y).
8. Gantt Chart
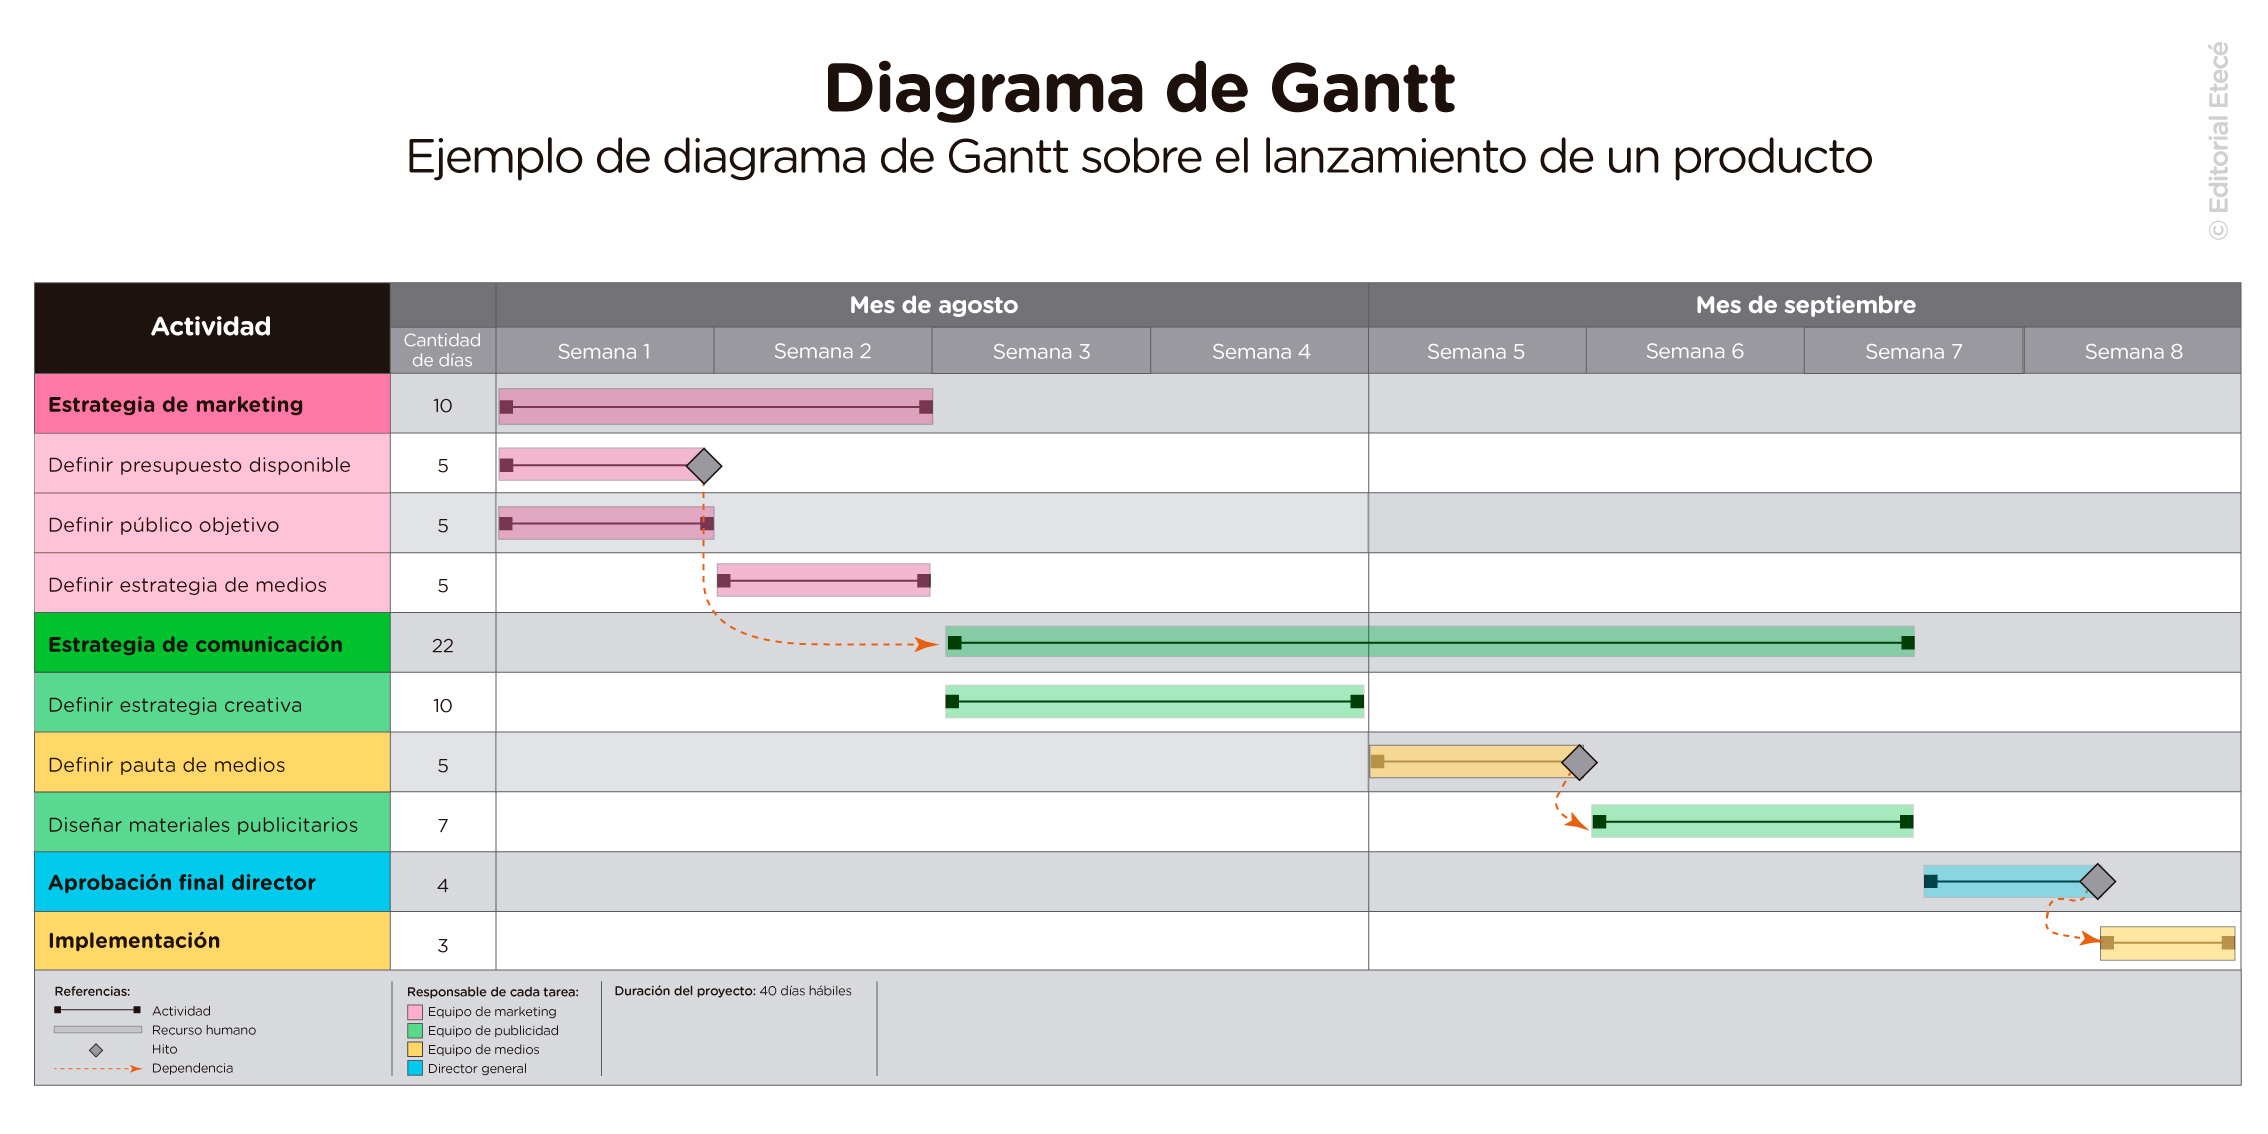
The Gantt chart is used to indicate all the tasks necessary to do a project. In addition, using bars or lines, it shows the duration of each activity and usually mentions who must carry it out.
9. Venn Diagram
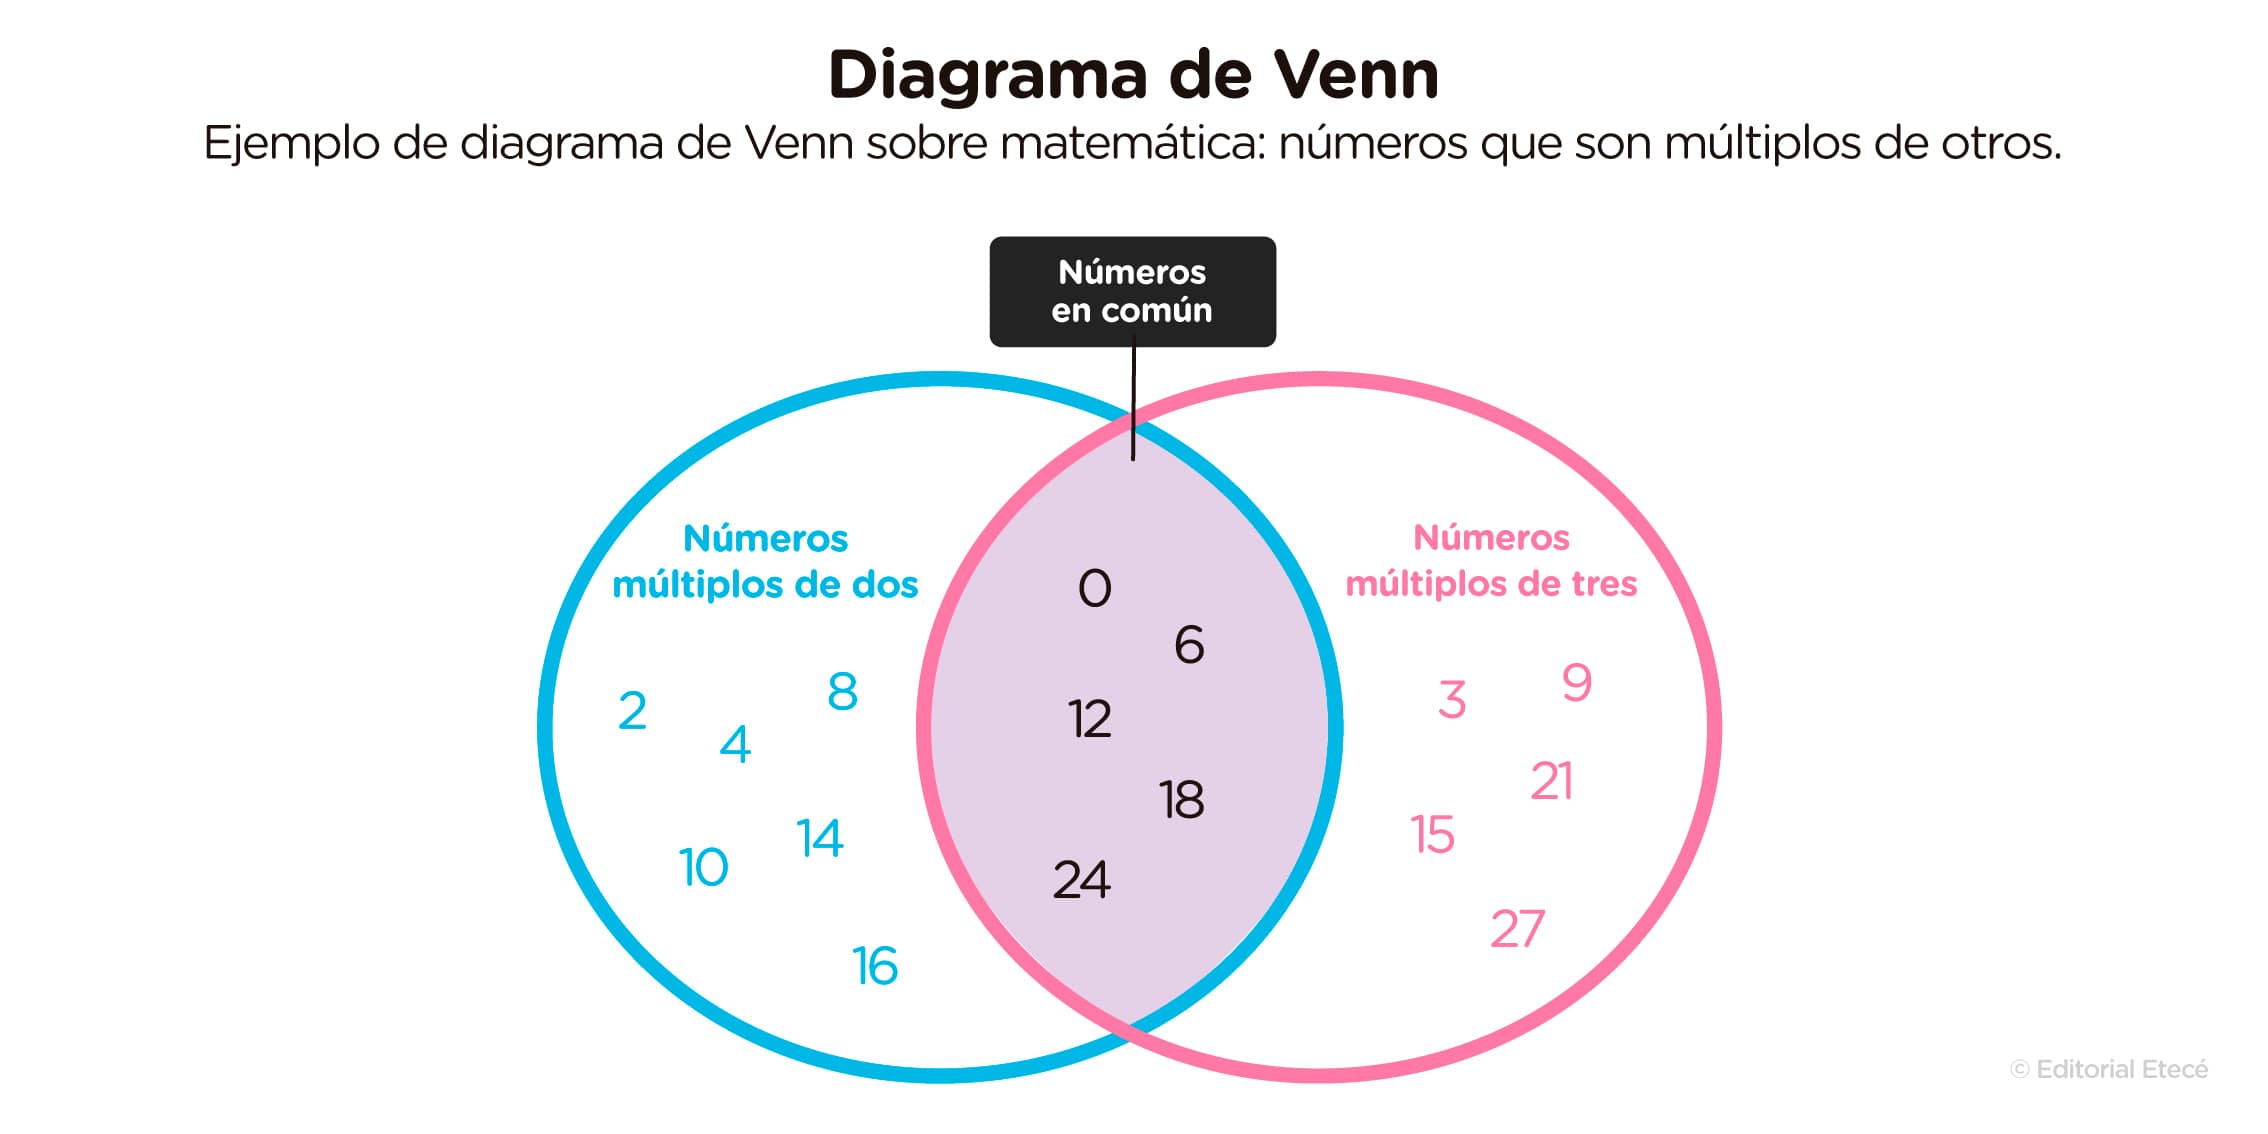
The Venn diagram is used to represent which characteristics two theories, ideas, or sets of elements share and which they do not.
This representation is achieved with the superposition of circles, since each one designates an idea or a set, and with the intersection the shared qualities are indicated.
10. Ishikawa diagram
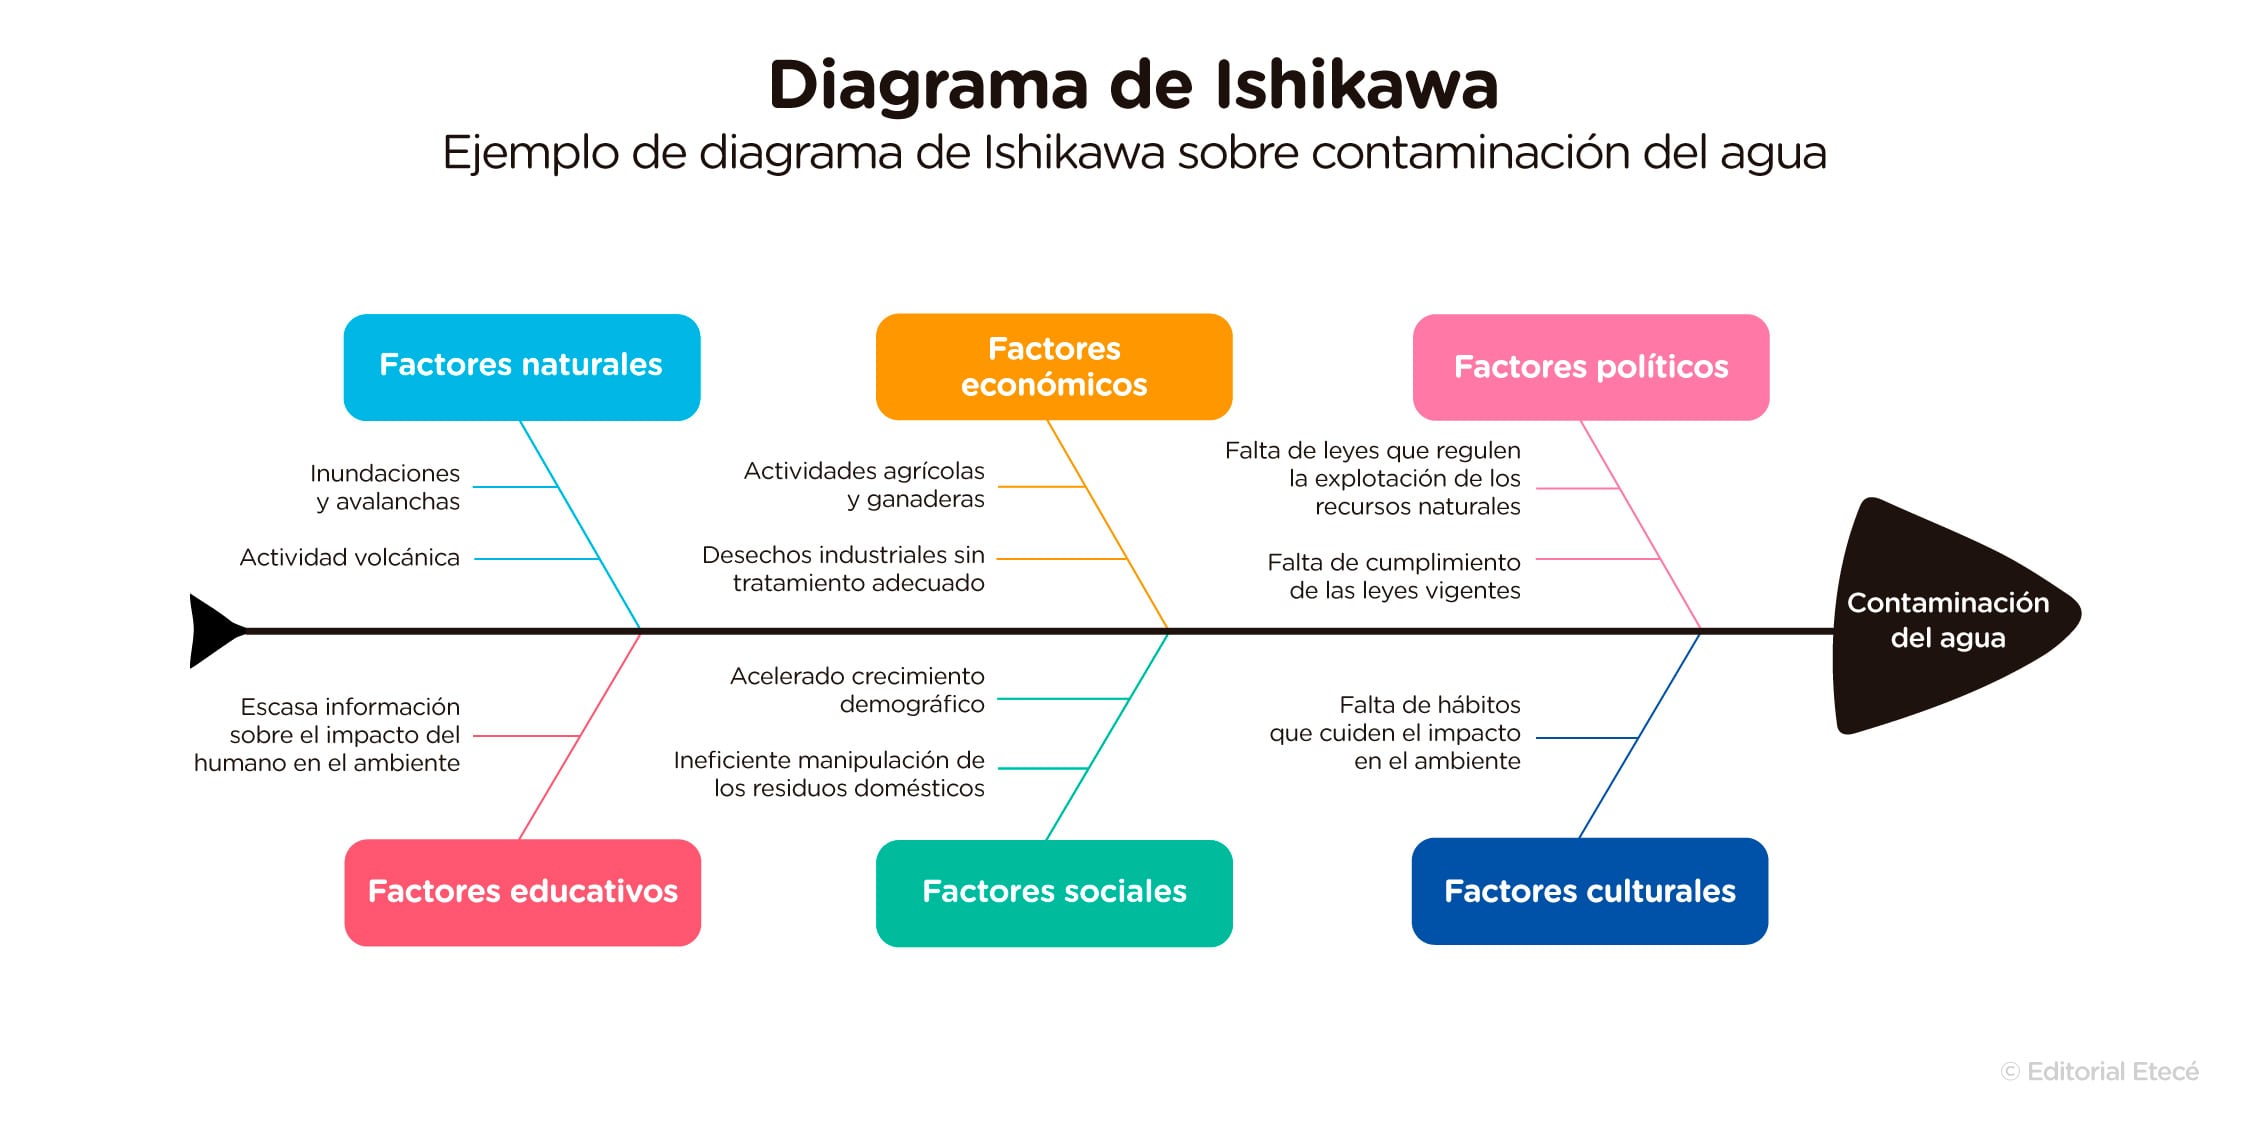
The Ishikawa diagram, also called a fishbone or cause and effect diagram, is used to show the causes of an event, problem or process.
Its name is due to the fact that it looks very similar to a fish, since it has a head in which the event, problem or process is mentioned; a central spine that connects the head to other spines; and main and secondary spines in which the causes or factors are mentioned.
11. Radial diagram

The radial diagram, also known as a mind map, is used to hierarchically organize information about a topic or idea.
It starts from a central theme or concept that is in the center of the diagram and from which secondary and tertiary concepts emerge. Concepts are connected by lines that, in many cases, are similar to dendrites or tree branches.
12. Pyramid diagram

The pyramid or pyramid diagram is a triangle divided into different parts. It is used to represent ideas taking into account different approaches, such as the hierarchy or quantities of certain elements, the steps or activities of a procedure, and process options.
13. Matrix diagram

The matrix or matrix diagram allows you to represent the relationship between at least two elements. Using rows, columns, symbols, and letters, it shows how different types of data are linked, such as objects, tasks, solutions, problems, causes, consequences, and individuals.
14. Narrative diagram
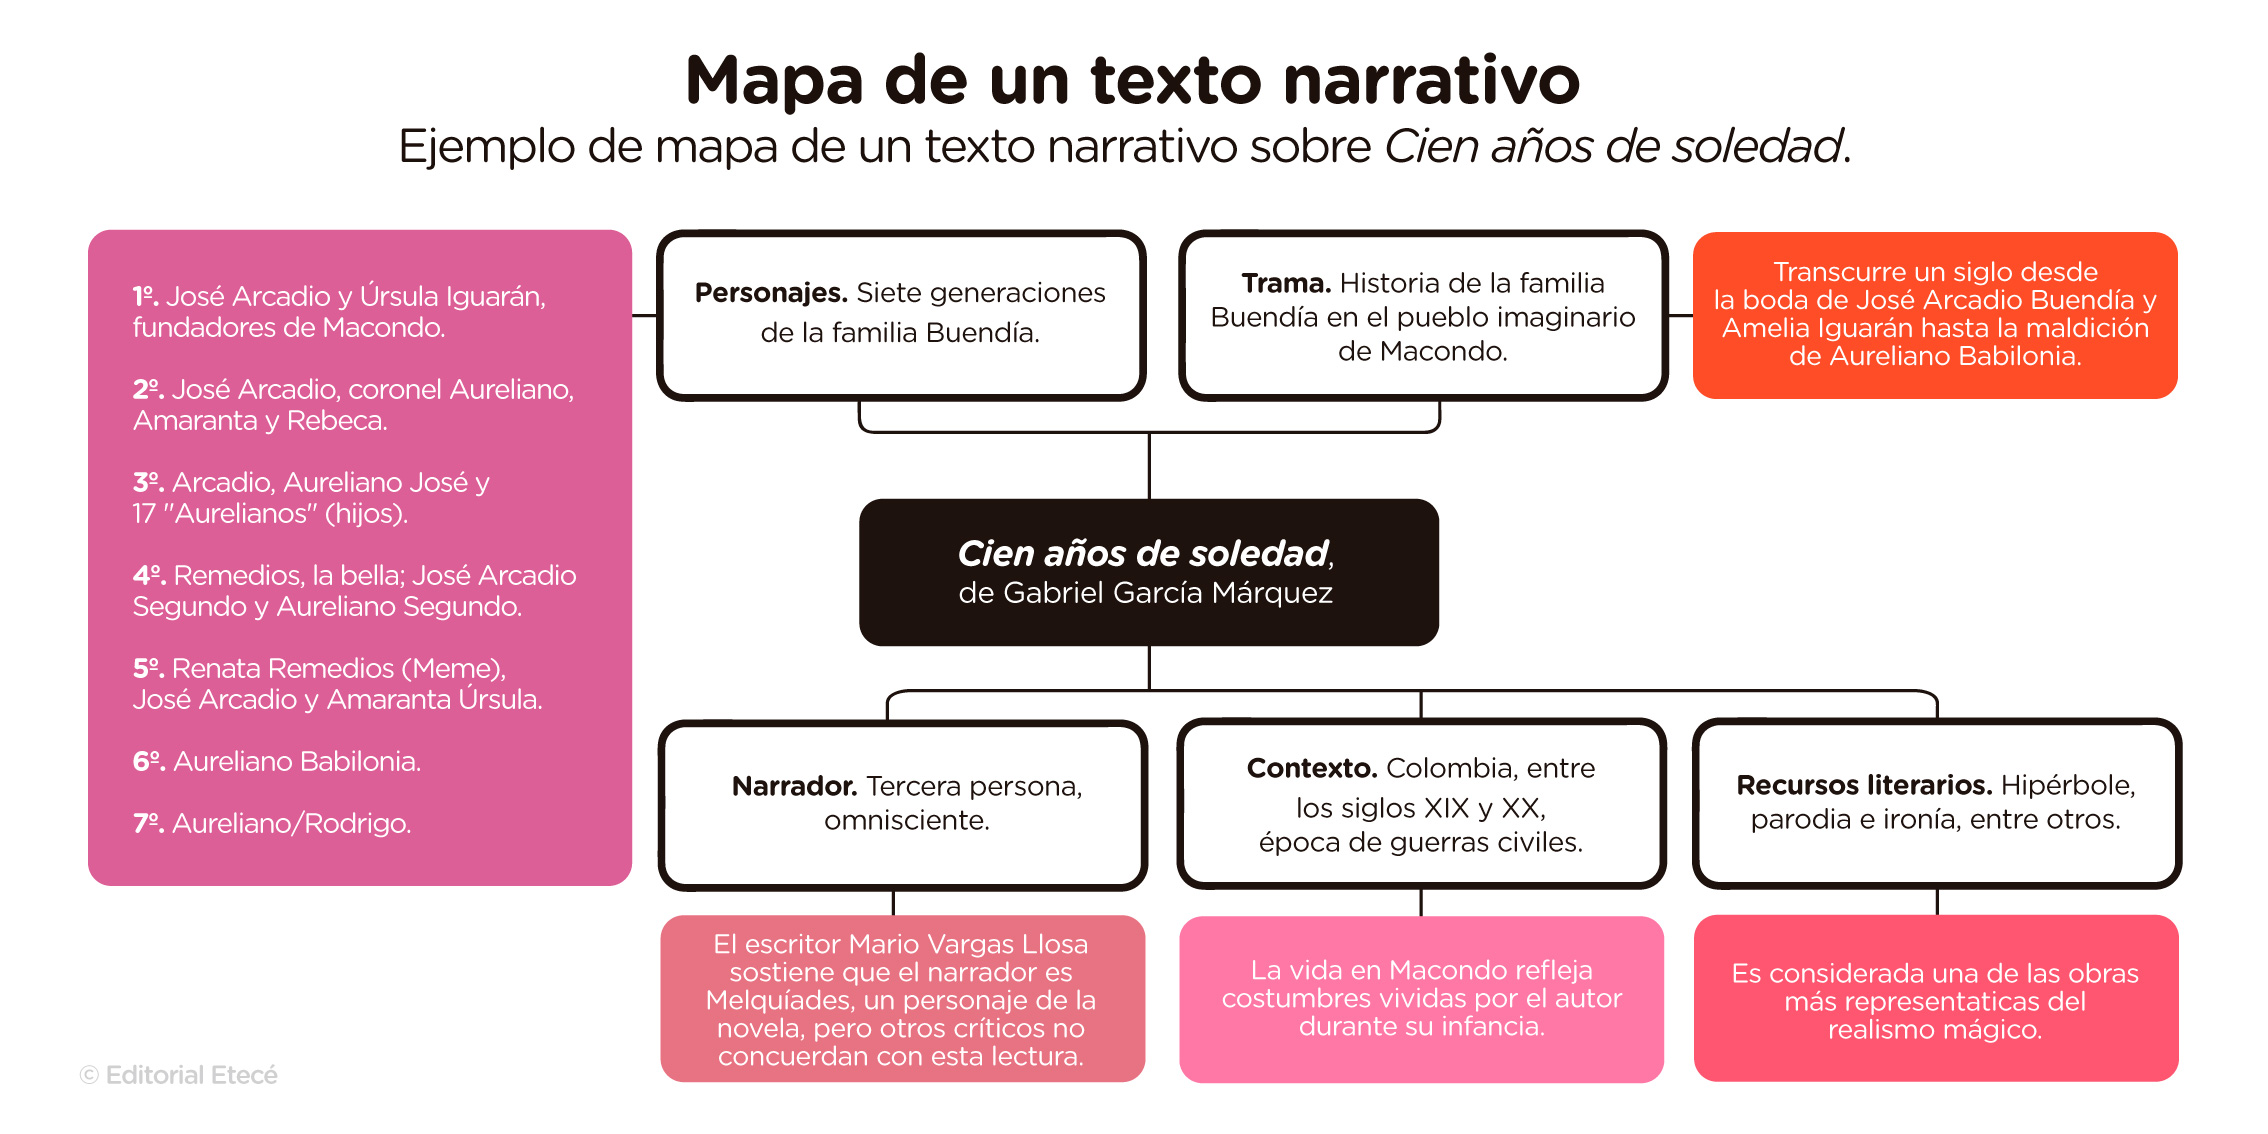
The narrative diagram, also called a map of a narrative text, is used to indicate the elements of a novel or a story.
The name of the text is usually placed in the center and, connected with arrows, its most relevant elements are mentioned, such as its plot, its characters, its narrator and its literary devices.
15. Family diagram

The familiogram, also called genogram or family tree, is a diagram that is mainly used in medicine and psychology to understand family ties and/or the characteristics, pathologies or hereditary diseases of a person.
What is a diagram for?
The diagrams are used to:
- Show very complex information in a simple way . They allow many concepts, ideas and processes to be condensed in a small space and in such a way that they are easy to understand. Furthermore, they indicate what type of link there is between the different elements of a topic.
- Study various subjects . They are used in different disciplines, such as history and biology, because they allow you to synthesize and help memorize very complex ideas.
- Communicate projects, processes and training . They are used in institutions and companies to provide the necessary information on a matter.
- Guide an exhibition . They highlight the key concepts of an exhibition and also show the relationship between the different elements. In this way, the public can also understand the information faster and better.
How to make a diagram?
To make a diagram, you must follow a series of steps:
- Determine the topic to graph . For this first step, you must have the topic defined and you must have all the information necessary to make the graph. For example, if it is a text, it should be read underlining the main and secondary ideas.
- Select what information to include . You must determine which are the most important concepts or ideas and synthesize them with key words.
- Choose a diagram type . Depending on the objective and how you want to present the information, the most convenient diagram must be chosen. For example, to synthesize a text, you can use the synoptic diagram or the conceptual diagram.
- Make a sketch . A draft of the diagram must be made, including the keywords and visual resources necessary to structure the information and the relationship between the ideas.
- Make the diagram . The final version must be made; for this, it is recommended to use different colors and include images.
References
- Duncan, K. (2013). The book of diagrams. 50 visual solutions to solve problems. Fight.
- Fau, M. (2023). How to study with graphs, diagrams and charts. The hinge.
- University of Granada. Block diagram. https://www.ugr.es/


